Homework 1: Project data life cycle
Required reading, Chapter 2 — Introduction, in Mike’s Biostatistics Book, particularly Projects and the data lifecycle of Ch02.5 — Scientific method and where statistics fits. Additional suggested readings are listed in Suggested readings at the end of this page.
This homework has four parts, A, B, C, and D. Part A requests.
Homework 1 expectations: Students will be able to
- Propose a research idea for the semester.
- Identify and describe the major stages of the data life cycle.
- Organize and map research project phases to corresponding data life cycle stages.
- Apply the data life cycle framework to your own project by creating a visual representation (e.g., mind map or diagram).
- Evaluate examples of scientific studies to distinguish between poor and strong research practices, and explain how the scientific method and project management guard against “bad science.”
BI-311 students: answer all the questions for full-credit consideration, BONUS questions not required, of course. Submit your work to CANVAS.
What to turn in: A pdf file containing your answers to all questions and relevant R code; by relevant we mean include your code, not copies of code provided to you. For statistical results, report appropriate significant figures. Use of RMarkdown recommended — because it is a simple way to include graphs generated; however copy/paste into a word document, then converted to pdf, is also acceptable.
Submit your responses at Homework 1 – Data life cycle in CANVAS. A template is suggested in CANVAS — current CUH ID and sign-in required.
Note 1: You do not NEED R/Rcmdr to do the work required in Homework 1. Two R packages, iGraph and plan, are introduced with examples.
Limited answers to Homework 1 are available, click here
Detailed responses to student homework provided in CANVAS
Part A
In your own words, describe a project idea. The idea can come from our class discussions or it may be from another class, or, it may be unrelated to any biology, environmental sciences, or health class you are currently taking.
These projects are an important part of your learning how to apply statistical and data science concepts, so this first step is crucial. Importantly, keep in mind that you need to receive approval from the biostats instructor to conduct your project.
All proposed projects must comply with institutional and federal research ethics guidelines. For this course, projects are limited to non–human subjects as wells as non-vertebrates if animal subjects research. Projects meeting these criteria generally do not require review by an Institutional Review Board. That is, no projects involving new surveys of students and their use of caffeine or sleep habits or stress assessments, for example.
Biostatistics is not just about human-subject research. It encompasses analysis of biological, environmental, and forensic data, and students are encouraged to design projects aligned with these areas.
In general, I recommend meta-analysis as semester projects. However, experimental projects are welcome and encouraged, with the following constraints:
- Laboratory studies using microorganisms, cell cultures, or invertebrate systems (as permitted)
- Environmental sampling and analysis (e.g., water quality, soil composition, microbial diversity)
- Forensic-style investigations using simulated or non-human biological materials
- Bench or field experiments generating original, non-human biological data
Students may also pursue data-driven approaches such as:
- Meta-analysis: Systematic review and synthesis of published literature or aggregate datasets
- Secondary data analysis:** Use of publicly available, de-identified datasets (e.g., NHANES, Kaggle, NIH repositories)
- Simulation studies: Computational modeling of biological systems, epidemiological dynamics, or statistical processes
- Public data analysis: Analysis of public-domain datasets such as census or public health surveillance data
Data Use Requirement: All datasets must be publicly accessible and fully de-identified, with no ability to trace information to individual persons. Projects should focus on biological systems, populations, environments, or institutions rather than identifiable individuals.
For your project idea, criteria to address include:
- scientific merit
- description of the methodology
- describe one or more testable hypotheses
- references
You’ve already submitted an idea for a project — now, brainstorm about your idea and address the first two steps of project management for your project: initiation and planning.
Remember, this is just the start. Your project can change, and, at the very least, is likely to change over the next few weeks as you work to refine the ideas and develop the research plan.
Part B
Identify steps of your research plan. Include a timeline consistent with the due dates for the graded elements of the project.
Graded project items include:
| proposal |
| data |
| analysis |
| meetings |
| report |
| present |
see the course syllabus for descriptions of the graded project items.
Bonus: Provide a Gantt chart for the graded project items.
With R: https://jtr13.github.io/cc19/gantt-charts.html
With Google Sheets: https://support.google.com/docs/thread/231691594/can-i-create-gantt-charts-using-google-sheets?hl=en
For R code, use the plan package. Example code:
library(plan)
# modified from the gantt example data set in plan.
g <- new("gantt")
g <- ganttAddTask(g, "Activities") # just a heading
g <- ganttAddTask(g, "Proposal", "2025-08-25", "2025-09-12", done=100)
g <- ganttAddTask(g, "Data", "2025-09-12", "2025-10-17")
g <- ganttAddTask(g, "Analysis", "2025-10-17", "2025-11-14")
g <- ganttAddTask(g, "Meetings", "2025-09-15", "2025-11-14")
g <- ganttAddTask(g, "Present", "2025-12-01", "2025-12-05")
g <- ganttAddTask(g, "Report", "2025-12-01", "2025-12-05")
# this next line handles the heading, where "start" is NA
font <- ifelse(is.na(g[["start"]]), 2, 1)
plot(g, ylabel=list(font=font),
event.time="2025-10-01", event.label="Current day")
par(lend="square") # default is round
legend("topright", pch=22, pt.cex=2, pt.bg=gray(c(0.3, 0.9)),
border="black", xpd=NA,
legend=c("Done", "To do"), title="BI311 project plan", bg="white")
which returns the following graph (Fig 1).
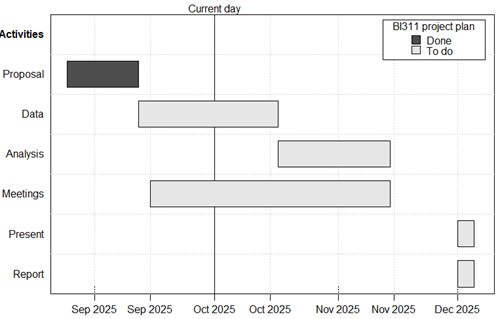
Figure 1. Gantt chart for BI311 Research Project graded items, Fall 2025 (updated week 6).
For the assignment, replace A, B, C, etc, with labels for steps in the data life cycle and replaced start and end times per your plan, not just the graded items plan.
Part C
You’ve already submitted an idea for a project — now, brainstorm about your idea and address the steps of data life cycle for your project. Make a graphic to describe the data life cycle for your project. I suggest a “mind map” approach. Refer to Projects and the data lifecycle, Mike’s Biostatistics Book.
After reading the short article, “8 Steps in the Data Life Cycle,” by Tim Tobierski of Harvard Business School (briefly discussed in Ch02.5 of Mike’s Biostatistics book), answer the following questions
- What are the data life cycle elements or steps?
- Organize life cycle steps into a table (eg, Word, Excel, etc.), with the first column describing the five project management steps, and the second column matched steps from the data life cycle.
- All projects have five phases of project management to address: initiation, planning, execution, monitoring and control, and closure. In other words, a beginning, a middle, and an end.
- Draw a graph of your project’s data life cycle. Lots of options how to create the graphic, from PowerPoint (Google Slides) to draw.io.
- Organize life cycle steps into a table (eg, Word, Excel, etc.), with the first column describing the five project management steps, and the second column matched steps from the data life cycle.
For R code, use the iGraph package. Example code:
library(igraph)
g <- graph_from_literal(A - B - C - D - E - F)
layout_on_grid(g)
plot(g,
    layout=layout_on_grid,
    vertex.size = 25,
    vertex.color = "lightgreen",
    vertex.label.cex = 0.8,
    edge.arrow.mode = 2,
    edge.arrow.size = .5,
    edge.color = "darkgray"
    )
which returns the following graph (Fig 2).
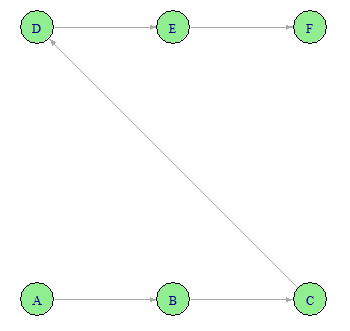
Figure 2. Example uni-directional map with iGraph.
For the assignment, replace A, B, C, etc, with labels for steps in the data life cycle.
Part D
It is “bad science” if your conclusions cannot be generalized to a reference population. Do you agree or disagree? Remember — we are obligated to provide evidence to support our opinions. Using materials from the readings, justify your position and include your design criteria for distinguishing good/bad science.
Notes and suggested readings:
By “generalizable,” we mean that a study’s findings and conclusions can be applied to a larger group of people or situations (ie, the reference population) beyond the specific sample and context of the study itself.
Chapters 2.4 and 2.5 in Mike’s Biostatistics Book.
Kinraide, T. B., & Denison, R. F. (2003). Strong inference: The way of science. The American Biology Teacher, 65(6), 419–424.
Ozonoff, D. M., & Grandjean, P. (2020). What is useful research? The good, the bad, and the stable. Environmental Health, 19(1), 2.
Platt, J. R. (1964). Strong Inference. Science, 146(3642), 347–353.
/MD