Answers: t-tests and ANOVA
Answers to selected problems
1
a. boxplot
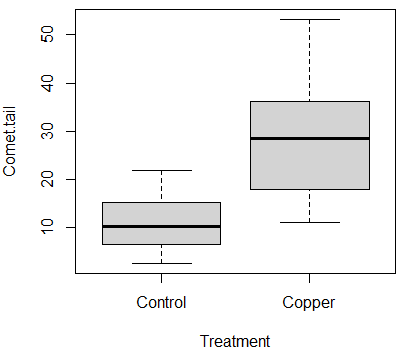
We can see that copper-treated cells have longer comet tails (i.e., more DNA damage).
b. Shapiro-Wilk normality test
data: Comet.tail
W = 0.91662, p-value = 0.006038
Results from independent sample t-test
t.test(Comet.tail~Treatment, alternative='two.sided', conf.level=.95, var.equal=TRUE, data=myComet)

Two Sample t-test

data: Comet.tail by Treatment
t = -5.8502, df = 38, p-value = 0.0000009139
alternative hypothesis: true difference in means between group Control and group Copper is not equal to 0
95 percent confidence interval:
-22.39865 -10.88213
sample estimates:
mean in group Control mean in group Copper
11.14533 27.78571
Note: I can tell that this is the t-test and not the default Welch test because the df are as I would expect for a t-test (df = 38, not the 26.869 you’d get for the Welch test)
c. mean in group Copper was greater (27.8 vs 11.1)
d. Assumptions of any parametric test are normality and equal variances.
e. “two-sided means we are testing null hypothesis that control and copper-treated cells have same mean
f. Several ways to write the null: see answer to “e”, or there’s no difference between sample means.
g. two-sided, confirm from output from t-test: “alternative hypothesis: true difference in means between group Control and group Copper is not equal to 0”
h. t = -5.8502; the reason the value is negative is because the program subtracted mean from the treatment group from the mean for the control group. See answer to “c” above.
i. df = 38
j. We have to look this up from critical values from t-table in Mike’s Biostatistics Book or simply query
Rcmdr: Distributions > Continuous distributions > t-distribution > t-quantiles.
Because we want two-tailed, we divide 0.05 by 2 = 0.025
qt(c(.025), df=38, lower.tail=FALSE)
[1] 2.024394
Note: Critical values for t-table in Mike’s Biostatistics Book reports critical values for 35 and 40 DF, so we’d have to interpolate if we wanted to use the table.
k. lower limit of 95% CI for difference is -22.39865
l. Hint: go back through t-test again, select options and set the confidence interval from 0.95 to 0.99
lower limit of 99% CI for difference is -24.353240
m. False. 95% CI does not include zero (it would if we FAILED to reject null hypothesis).
n. Note that our results clearly indicate we reject the null hypothesis (p-value = 0.0000009139)