Spreadsheets and data entry
This page describes Mike’s rules (suggestions) for data entry with spreadsheets.
- Organizing the data file
- Data entry checklist
- General tips
- Examples of spreadsheets for a simple data set
- Conclusions
These suggestions are general and apply to Microsoft Excel, LibreOffice Calc, and Google Sheets. General principles outlined apply to all spreadsheet apps, including Apple Numbers. The suggestions assume the user intends to import data into R for additional data processing and analysis.
As a team, decide and record roles for each team member: roles may include reporter, data entry, data verification, data calculator
Before collecting data, discuss and come to agreement — What is the primary aim (question) of the project? What is to be measured? How do we record data (paper lab notebook, digital notebook, spreadsheet)?
If multiple reporters of data are involved, then spend time with a data entry form. Google Forms is easy to use and it permits linking to Google Sheets. Once the form is done, simply add data via the form and the spreadsheet file is automatically populated with your data.
General scheme for a spreadsheet data file
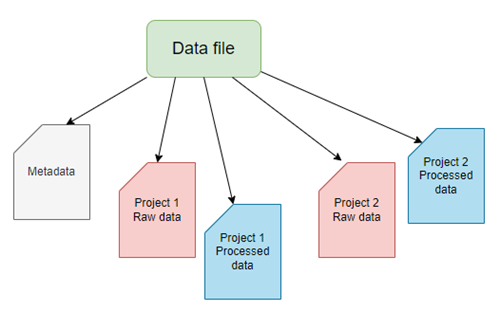
Figure 1. A general scheme for a spreadsheet data file with five sheets (workbooks). For this example, the workbooks consist of a single metadata sheet and sheets for data of the two projects. Each project is organized into one sheet for raw data and one sheet for any processed data.
Data entry and data file checklist
Note: Lots of items here and clearly, some or more essential to include than others.
| Description | Pertains to | Criteria |
|---|---|---|
| File extension | File | File saved as proper file type |
| Filename | File | Follows proper file naming protocols |
| One project per worksheet | File | If multiple projects, then each reported in its own sheet |
| Worksheets | File | Each sheet renamed |
| Censored data | Metadata | How are censored data marked |
| Describe measure | Metadata | For each measure or observation, include brief description of how measure was made |
| Instruments used | Metadata | Include with description the instrument used, including manufacturer if relevant |
| Metadata sheet included | Metadata | Includes one data dictionary sheet with appropriate documentation |
| Missing value defined | Metadata | Report how missing values treated. Do not use 0 for missing value |
| Numerical entry | Metadata | Report, cell type (decimal, fraction) |
| Project date | Metadata | Date of project recorded |
| Project description | Metadata | Identify the project and briefly describe purpose or question(s) asked |
| Project time | Metadata | If relevant, start and end time of project recorded |
| Primary data recorded | Metadata | Clearly identify raw vs processed numbers |
| Record keeping | Metadata | Identify format of original data and archiving strategy. |
| Significant figures | Metadata | Specifies number of significant figures used |
| Subject ID | Metadata | Data entry used subject ID |
| Team members | Metadata | Metadata contains list of personnel and roles |
| Truncated data | Metadata | How are truncated data marked? |
| Units defined | Metadata | Metadata contains list of units for each observation or measurement type |
| Consistent data organization | Sheet | Data are organized in stacked (narrow) or unstacked (wide) format |
| No formatting | Sheet | No borders, no color, no bold type, etc. |
| No mixed data types | Sheet | Each column contains numbers or text, not mix of both |
| Observation Comments | Sheet | Include notes needed to clarify observations |
| Observation date | Sheet | If relevant, date observation recorded |
| Observation time | Sheet | If relevant, time observation recorded |
| Rows by Columns | Sheet | Data oriented by rows (individual subject) and columns: (variables) |
| Subject ID vs Observer | Sheet | Observer and subject clearly defined |
| Variable names | Sheet | Proper variable names, one word or acronym, no spaces |
Tips for using spreadsheet apps for data entry
Because this page is about data entry and spreadsheets, we’ll move past general discussions about how to measure and to record data to focus on how to do data entry.
- Before working with spreadsheet data, turn off
- automatic completion/input features.
LibreOffice Calc: Tools → AutoInput;
Microsoft Excel: File → Options → Advanced and clear the Enable AutoComplete for cell values check box;
Google Sheets: Tools → Autocomplete, then deselect Enable autocomplete. - automatic correction features.
LibreOffice Calc: Tools → Auto Correct options → Options and Local options tabs, then deselect selections;
Microsoft Excel: File → Options → Proofing and clear the various check boxes;
Google Sheets apparently lacks auto correct (?). - Why? Because you need complete control of data entry. Auto complete functions GUESS your intent; Auto correct may change entries like
DAtatoData. Yes, that’s probably what you intended, but these “predictive text” features are known to cause data entry problems (see Ziemann and Abeysooriya 2021).- So yeah, proofing your data entries needs to be done and so it’s a good idea to share the process of data entry with some one — one person types the other proof reads each entry.
- AI tools may provide assistance — real-time data validation via vision tools that compare a raw data source against the entries made by data entry in the spreadsheet.
- AI can use advanced OCR to pull data from tables on an image.
- After data entry is complete, you can turn back on Spell check etc and partially automate proof reading.
- So yeah, proofing your data entries needs to be done and so it’s a good idea to share the process of data entry with some one — one person types the other proof reads each entry.
- automatic completion/input features.
- Spend time with the metadata, also known as the data dictionary or codebook.
- Enter names of observers and their contact information
- Enter date and time of observations
- Include statement about the time format used, e.g., month-day-year is common in USA, but not other countries.
- Similarly for time, include statement of time format. Spreadsheets are notorious for
- List the variable by name (remember, short names are best, no spaces, no special characters) and include a description of the variable name, even if it seems obvious.
- Declare the data type and units for each variable.
- Enter date and time of data entry — which can be different than date/time of observation and data collection.
- Provide a brief overview of what the data is about — what purpose was the data collected for?
- Record names of persons who did data entry and proofing.
- After creating the sheet with metadata, create a second sheet for the raw data or primary data.
- Set up the spreadsheet as rows and columns. Columns are for variables, rows are for observations. Observations typically are the sampling unit.
- For example, repeat observations of blood pressure on a subject, the row starts with the subject id, then each column is a single reading of blood pressure.
- For composite measures like blood pressure, there should be a Systolic column and a Diastolic column — avoid writing composite measures as 120/80.
- For example, repeat observations of blood pressure on a subject, the row starts with the subject id, then each column is a single reading of blood pressure.
- Do not mix type: a column should have either numbers or text, not both.
- For example, 120 mmHg is not a good entry because both number and text are included. Thus, the entire column is treated as text.
- And besides, you reported units in the metadata, didn’t you?
- For example, 120 mmHg is not a good entry because both number and text are included. Thus, the entire column is treated as text.
- Set up the spreadsheet as rows and columns. Columns are for variables, rows are for observations. Observations typically are the sampling unit.
- Create a third worksheet for data wrangling, the process of converting raw data into a usable form. For example, our raw data for calorimeter includes mass of water, initial and final water temperatures, initial and final mass of food sample. We want the kilocalories per gram of food stuff; formulas to accomplish these calculations should be in this third worksheet.
- Continuing on this theme, plots belong in their own worksheets, not the sheets with raw data.
- Decide how missing data will be identified in the data set.
- Missing values can be identified in the spreadsheet as an empty or blank cell; during import into R, R can be instructed to treat empty cells as missing values as
NAfor Not Applicable.- Python uses
NoneandNaNfor Not a Number in thepandaslibrary.
- Python uses
- Missing values can be identified in the spreadsheet as an empty or blank cell; during import into R, R can be instructed to treat empty cells as missing values as
- This is just a start, and rather than reading me, go to Preparing Data in Excel at College of Public Health at University of Nebraska Medical Center. Their site, and many others, provide good guidelines that will stand you well.
Examples of spreadsheets for a simple data set.
It goes without saying — it’s better to get the raw data into a spreadsheet file than not at all. There’s plenty of guidance out there for applying data wrangling approaches to cleaning and transforming raw data into usable form. It’s also obvious — it’s easier to anticipate the structure and perform data entry according to how the structured data need to be for subsequent analytical steps. Figure 2 through Figure 4 show examples of simple data sets, but with increasing data cleaning demands.
Figure 2 shows an ideal, simple spreadsheet entry. No mixed data types in columns, the column header is in the first row with simple, descriptive one word entries, and data begins in the next row. We assume that the data dictionary, including units and descriptions of Brand and other column headers are in a separate worksheet in the spreadsheet file.
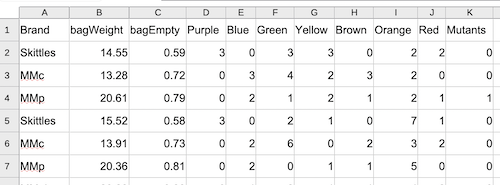
Figure 2. Screenshot of a typical data sheet, just rows and columns with short, descriptive words as column headers. LibreOffice Calc. Image included in Part 05. R packages: Making R do more.
Figure 3 shows the same spreadsheet entry Fig 2. However, rows one through four contain elements of a data dictionary: units and descriptions of Brand and other column headers. This format is acceptable; it just requires the user to enter additional commands to specify the format and location of the data.
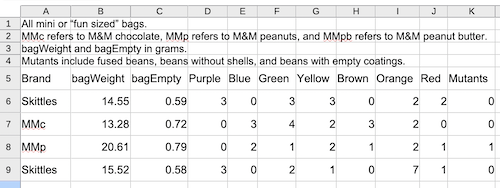
Figure 3. Screenshot of a data sheet with a few rows of meta information and the data in row 5 with short, descriptive words as column headers. LibreOffice Calc. Image included in Part 05. R packages: Making R do more.
Figure 4 shows the same data, but entered in a way that will require substantial data wrangling. Columns B through K now contain mixed data types in the cells, a mix of numbers and text. Header information in column B and C now also include spaces and special characters that are likely to cause problems during import. For example, during data import, you can force R to import names like bagWeight (g), but it would require enclosing the name in single quotes, like ‘bagWeight (g)’. However, including () in an object or variable name will cause a syntax error when called.
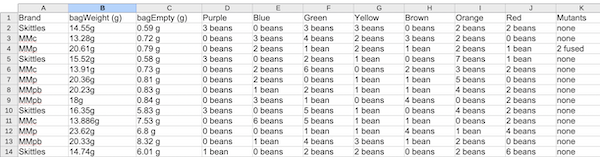
Figure 4. Screenshot of a data sheet with mixed data types — numbers and text in the same cell — and column headers with spaces, units, and other characters — bagEmpty (g) — that will cause R problems during import. LibreOffice Calc.
Conclusions
Enforcing strict data entry rules is probably better for long-term data integrity and operational efficiency, while data wrangling after the fact is often necessary for disparate or legacy data sources. The ideal approach is to combine both: implementing validation rules at the source (pre-entry) and using automated, documented workflows for necessary cleaning later (post-entry). Modern spreadsheet apps include many features designed to help at both stages; R programming language includes many packages to assist data wrangling.
Suggested readings
Broman, K. W., & Woo, K. H. (2018). Data Organization in Spreadsheets. The American Statistician, 72(1), 2–10.
Lapatas, V., Stefanidakis, M., Jimenez, R. C., Via, A., & Schneider, M. V. (2015). Data integration in biological research: An overview. Journal of Biological Research-Thessaloniki, 22(1), 9.
Tierney, N., & Cook, D. (2023). Expanding Tidy Data Principles to Facilitate Missing Data Exploration, Visualization and Assessment of Imputations. Journal of Statistical Software, 105, 1–31.
/MD