Homework02A: Measurement
Fall 2026
This page is under construction.
This homework is about exploring data and is in three parts: this part, Homework 2A is about measurement. Homework 2B, is about Central tendency and Measures of dispersion of data using descriptive (aka summary) statistics. Homework 2C is about data visualization and applies to the same data sets described on this page.
BI311 students: What to turn in
BI-311 students: For homework reports, report only your answers for the even numbered questions; answers to the odd numbered problems are provided to you. Read through the entire homework before starting to answer a question — all questions are intended to help you achieve the learning outcomes for the chapter. It is recommended that you work through the odd numbered problems on your own to confirm your work and as a guide to work the other problems.
Homework 2A expectations
BI311 students. Homework 2A is BONUS only. However, it is a key exercise to understand several fundamental principles about measurement and inference, so completing the work is highly recommended.
Read through the entire homework before starting to answer a question. Relevant readings in Mike’s Biostatistics Book include
- Chapter 3.1 Data types
- Chapter 3.5 Statistics of error
- Making sense of error in data
- Statistics of error
- Error and the observer
- Chapter 16.5 Instrument reliability and validity
This page asks you to make measures of sea star legs (length, width) from images. One could simply apply a flexible ruler to the computer screen, but a far more elegant and accurate approach is to use ImageJ (link to FIJI, which bundles many plugins that facilitate image processing and analysis). I have a page to support this kind of exercise in Mike’s Genetics & Genomics Workbook: Help with imageJ.
All of the coding required was included in Chapter 3 of Mike’s Biostatistics Book. See also relevant tutorials in R work.
How to work this homework
You may work together, but each of your must turn in your own report. Don’t “plagiarize” from each other. Do include in your report who you worked with.
What to turn in: A pdf file containing your answers to the even-numbered questions and relevant R code (hide R code that DrD provide you!); by relevant we mean include your code, not copies of code provided to you. For statistical results, report appropriate significant figures. Use of RMarkdown recommended — because it is a simple way to include graphs generated; however copy/paste into a word document, then converted to pdf, is also acceptable.
Note 1: By relevant we mean provide just the R code and results from R functions necessary to support your answers to the questions. For example, do not include
- the entire data set when head(dataset) will do
- screenshots of R output!! R output is text — copy/paste
- all statistical output from an R function.
See Part09: Making a report for an example homework file.
Submit your work to CANVAS. Please obey proper file naming formats.
Resources for this homework
Help with imageJ (FIJI) at Mike’s Genetics & Genomics Workbook: Help with imageJ.
Mike’s Biostatistics Book: Chapter 3
Answers to odd numbered questions
Mike’s Workbook for Biostatistics: A quick look at R and R Commander, Part01 – Part10 and refer also to code presented in Homework 2 from this workbook.
Additional R commands and or code provided below.
Questions
The goal is to measure lengths and widths of each arm (ambulacral ray) of individual Linckia sea stars shown in Figure 1.
Goal.
Introduction to how to assess instrument acuracy.
Objective.
To record a data set that includes technical replicates for use in other homeworks.
Overview.
Recall a basic goal of measurement is to ensure recording reflect truth (accuracy). Per the statistics of error, that means we need repeated measures of the object in order to calculate the confidence of our measurements. These are refered to as technical replicates — repeated measures of the exact same biological sample. Think of it this way. By taking repeated measures of the same thing using the same instrument and same procedures, then any difference in the measures reflects random noise (random error). We gain confidence in the estimate by comparing the variability or repeated measures; the average of the repeated measures is taken as the most accurate estimate of the sample, but having all of the measures provides us powerful analytical edge, particularly if we wish to talk about individual differences.
Repeated measures of different biological samples informs us about biological (phenotype) variation, the differences among individual samples. Without first demonstrating technical repeatability, we cannot confidently conclude that differences among biological samples is due to individual differences as opposed to measurement error.
The practical implications are that, while each of the sea stars has five arms, and while it is logical to measure each arm once, you need to record the arm length for arm #1 three times — more if the measure is inaccurate — and it is the average that provides the accuracy. Thus, a minimum of three repeat measures are taken for each arm. In the end, then just for lengths alone, each specimen has 15 measures, three for each arm.
Question. While simple enough, get three repeated measures, how exactly should you proceed? When taking three repeated measurements of each arm for a sample of sea stars to quantify true intra-observer measurement error, which workflow should you implement?
- Measure all five arms on Sea Star A sequentially three times in a row, then move on to Sea Star B.
- Measure all five arms on Sea Star A once, then immediately measure them a second time, and then a third time before changing animals.
- Complete one full “wave” by measuring all five arms of Sea Star A, then all five arms of Sea Star B, and so on. Repeat this entire multi-animal circuit for the second and third waves.
- Have a partner hold the sea star and call out the measurements to you three times in rapid succession while you write them down.
C is the best answer, given the options. Moving to different individual sea stars forces a cognitive reset between observations. By the time you return to Sea Star 19 for the next wave, the immediate memory of its specific dimensions is broken, ensuring your repeated measures are genuinely independent and unbiased. It’s probably overboard, but hiding the ID tags and randomizing the order of sea stars isn’t a bad idea either.
The samples
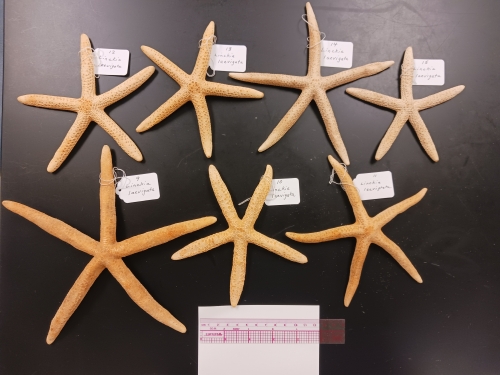
Figure 1. Aboral view of seven dried Linckia laevigata sea stars. Tag marks arm #3. Arm #2 is immediately to the left or arm #3, arm #1 is immediately to left of arm #2, and so on. A scale bar and white index card are also included for reference. Individual #9, 10, and 11 are bottom row from left to right; top row, left to right is #12 through 15.
To do.
Assign arm numbers. A common designation (eg Ji et al 2012; Trono et al 2015) for the first arm is to locate the madreporite or sieve plate (Fig 2, yellow arrow). The third arm is left of the madreporite, then arm #4 and subsequent arms follow clock-wise.
Hint. Because the image in Figure 1 is low resolution it’s hard to locate the madreporite — therefore, the tag marks arm number 3 and arm # 3 of each sea star in the image is pointed up (Fig 1).
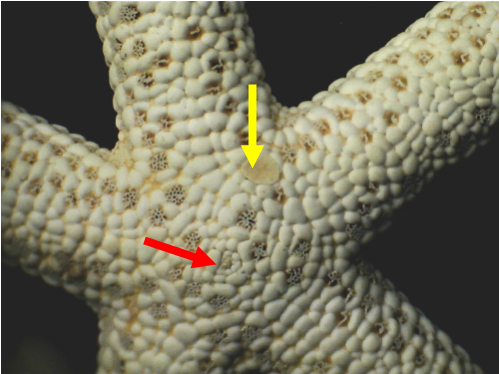
Figure 2. Aboral view of central disc (red arrow) and madreporite (yellow arrow) on a dried Linckia laevigata sample (not included in Fig 1).
Arm (ray) length is typically recorded from the central disc (Fig 2, red arrow) out to the tip of the arm in inches (in).
For arm width, measure the width close to the arm junction, where the arm meets the center disc in inches.
Protocol.
You’ll need a way to measure lengths from the image. One simple approach is to just place a ruler onto the image and, after determing how many inches a known distance is (use the ruler to mark out a distance), then record the number of pixels per inch.
A more advanced option is to take advantage of free image analysis tools used by professional biologists. See instructions for use of ImageJ (FIJI) at Mike’s Genetics & Genomics Workbook. The following instructions assume you install ImageJ (FIJI) onto your computer, but there is also an online option at https://ij.imjoy.io/.
Download the image in Figure 1 to your computer, then load the image file into ImageJ (Fiji). Next, set the measurements to record. Go to Analyze > Set Measurements… Uncheck all of the options – you just want linear measures.
Next, use the ruler captured with the sea stars to set the scale. Click on the line segment tool, then on the ruler, draw across a defined length (top of the ruler centimeters, bottom is the larger inches). The image is low resolution to save the server; expect about 23 pixels per inch. Use the same set scale for all the measures made on the image.
Once the scale is set, proceed to collect the linear and width measures for each arm of each of the seven specimen with the segmented line tool. For length of an arm, draw from the arm tip to the central disc, then Analyze > Measure. On specimen 9, length of arm #1 is about 4.6 inches.
For the arm width, draw a line across the arm near the base and repeat Analyze > Measure to collect estimates. For reference, n specimen 9, width of arm #1 is about 0.7 inches.
After all measures are completed, close the image, save the results, these are the first trial. Next, reload the image for the next series of measures (eg trial #2). Set the scale again, and proceed to record new estimates. It works best if you close the first set of results, perhaps even take a break so that your memory of the first trial fades. Ideally, each measure is independent of the other measure (bias).
Output.
FIJI will allow you to save results, which can then be input into your spreadsheet app. One data set may look like
| Specimen | Trial | Scale | Arm | Length | Width |
| 9 | 1 | 23 | 1 | 4.572 | 0.713 |
| 9 | 1 | 23 | 2 | ||
| 9 | 1 | 23 | 3 | ||
| 9 | 1 | 23 | 4 | ||
| 9 | 1 | 23 | 5 | ||
| 10 | 1 | 23 | 1 |
Scale is number or pixels per inch. Lengths in inches.
When finished, upload your spreadsheet file to CANVAS by the due date.
References
Ji, C., Wu, L., Zhao, W., Wang, S., & Lv, J. (2012). Echinoderms Have Bilateral Tendencies. PLoS ONE, 7(1), e28978.
Trono, D., Dacar, R., Quinones, L., & Tabugo, S. (2015). Fluctuating asymmetry and developmental instability in Protoreaster nodosus (Chocolate Chip Sea Star) as a biomarker for environmental stress. Computational Ecology & Software, 5(2), 119.