Answers – Homework01
Answers to Homework01
Back to Homework 1: Project data life cycle
1. The eight steps from the suggested reading (8 steps in the data life cycle, by Tim Stobierski Harvard Business School) were
Generation
Collection
Processing
Storage
Management
Analysis
Visualization
Interpretation
To make the answer more generic, I surveyed top 15 Google hits for “data life cycle steps” and then made a word cloud (Fig 1).

Figure 1. A collection of “data life cycle” steps from 15 web sites selected from Google search, September 2025.
The other questions are specific to student projects.
As a bonus, I suggested creating a Gantt plot.
Here’s a crude Gantt chart for our BI311 projects (Fig 2).
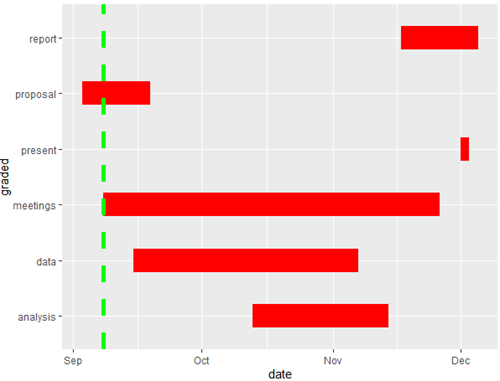
Figure 2. Gantt chart, BI311 project progress as of 8 September 2025.
R code follows. Remember, “#” is a comment line and is not interpreted by R.
# https://jtr13.github.io/cc19/gantt-charts.html library(tidyverse) # Next level package for project management called plan. # This page does not use plan -- future # library(plan) # BI311 project plan, graded activities only, for Fall 2025. myProject <- read.table(header=TRUE, sep=",", text=" graded, start, end proposal, 2025-09-03, 2025-09-19 data, 2025-09-15, 2025-11-07 analysis, 2025-10-13, 2025-11-14 meetings, 2025-09-08, 2025-11-26 report, 2025-11-17, 2025-12-05 present, 2025-12-01, 2025-12-03 ") # tidyverse includes the mutate() function, used to create # new columns or modify existing ones. # %>% is a pipe operator. Together with mutate, helps understand code. # Change dates from factor type to date type. myProj <- myProject %>% mutate(start = as.Date(start), end = as.Date(end)) # Check first six rows of the dataframe head(myProj) # the start and the end dates need to be in the same column. #gather()takes multiple columns in a wide dataset and collapses # them into two new columns: a "key" column and a "value" column. # We use stack() function from base R in Homework2A. myProj_tidy <- myProj %>% gather(key=date_type, value=date, -graded) #confirm by checking the new dataframe head(myProj_tidy) # make the gantt plot. Add vertical line (green, dashed) for current day. # We use ggplot2 here. Note use ofaes()(aesthetic) function to map # variables to the visual properties of a plot. We discuss use of ggplot2 in # Chapter 4 of Mike's Biostatistics Book. ggplot() + geom_line(data=myProj_tidy, mapping=aes(x=graded, y=date), color="red", size=10) + geom_hline(yintercept=as.Date("2025-09-08"), size=2, color="green", linetype="dashed") + coord_flip()
/MD