Basic R Command Reference
Best usage: copy/edit all R commands in a script file, run commands from the script.
The IDE RStudio provides a wonderful work arena for coding, including a script editor. However, I prefer to start students with the base R script editor. The editor presents a minimal interface: a console, a script window, and explicit command execution. That way we focus on R and not learning RStudio. The base R interface is also a part of the core installation from R. It exists across operating systems without additional dependencies.
To open the script editor
on macOS.
To open the script editor from the R.app
File > New Document
If successful, you’ll have two open windows like Fig 1.
on WinPC.
To open the script editor from RGui
File > New script.
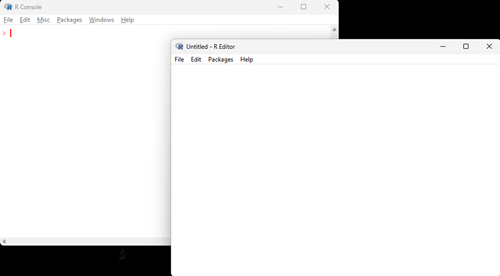
Figure 1. RGUI.exe on Windows 11 with open script editor.
Hints about writing R code
- Use your local R installation with built-in script editor or Google CoLab as your R environment.
- While other options are available, and highly recommended as you progress with coding, DrD will provide assistance with the former environments, not all possible R environments ;-).
- R is case sensitive.
Candyis treated by R as a different object thancandy. That means, type commands exactly as provided.- For example
candy<-will generate an error whilecandy <-will not — there was a missing space in the former instance. - Case sensitive coding is a common feature shared by most modern coding languages.
- Commands or object names may appear on web pages with single or double quotes. Do not include the quotes when typing or copying the commands or objects to your script file.
- All code printed in my eBooks has been verified, and every effort to maintain text-only entries of code on these pages has been made. Nevertheless, copying code from web pages may include formatting cues, which will cause errors when the code is run in R.
- Common instances of problematic web formatting include smart quotes; R works only with straight quotes. Line breaks and em-dashes may also cause problems.
- Copy/paste to and from your clipboard may be improved by using keyboard shortcuts Ctrl+Shift+V (Windows/Linux) or Cmd+Option+Shift+V (Mac) to paste as plain text.
- Sometimes, the best remedy may be to retype rather than trying to identify hidden formatting marks included in the copy/paste routine from the web page.
- A hashtag # on a line of code instructs R that subsequent work is to be treated as comment and not as code for interpretation by R.
- Judicious use of commenting is considered coding best practice (eg, UK Government Analytical Community 2020).
- Troubleshooting? See DrD, your R code does not work for suggestions how to get help with coding challenges.
To run code in the script editor
To run R code from a script file use the following methods:
on macOS.
Select lines of code to highlight, then run, either from the context menu or via keyboard shortcuts: Command + Return/Enter.
on WinPC.
Select lines of code to highlight, then run, either from the context menu or via keyboard shortcuts: Ctrl+R.
Note 1. RStudio users. The default R script editor and RStudio are separate programs and both should run without issue. If, however, the R script editor fails to open, the likely cause is an older installation of RStudio. Solve by updating to new RStudio or removing RStudio.
1. Creating Objects and Basic Math
|
Task |
R Code |
What It Does |
|
Assign a value |
|
Stores 5 in object |
|
Create a vector |
|
Creates a numeric vector |
|
Addition |
|
Adds values |
|
Division |
|
Divides values |
|
Sum |
|
Adds all elements |
|
Mean |
|
Calculates average |
The arrow operator <- is called the assignment operator. On your keyboard use two separate keys sequentially: first the less-than key (<) then the hyphen or minus key (-). In R programming, the arrow operator is the preferred and conventional way to assign values to variables, while the equals sign (=) is primarily used to specify named arguments in function calls. This convention enhances code readability and helps avoid subtle bugs.
2. Importing Data
| Task | R Code | Notes |
|---|---|---|
| Identify current working folder | getwd() |
Helps confirm “Where you are” in your computer’s file structure. |
| Set working folder |
|
Assumes working folder BI104 is on Desktop. Replace Username with your computer username. |
| Read CSV file |
|
Reads comma-separated file from working directory. |
| Create data from text |
|
header=TRUE uses first row as column names. sep=”,” specifies comma separation. |
| Show datasets |
|
Prints the data frame. |
| Show structure |
|
Displays rows, columns, and variable types. |
| Check working directory |
|
Shows where R looks for files. |
| Display part of an object |
|
Shows first six rows of candy. |
| Attach data frame |
|
Allows column names to be used directly (use cautiously). |
3. Accessing Data in a Data Frame
|
Task |
R Code |
What It Selects |
|
Select column by name |
|
Peanut column |
|
Select multiple columns |
|
Columns 2–4 |
|
Column totals |
|
Sum of each brand |
|
Create new object |
|
Stores result |
Note 2. use attach(candy) to avoid having to call the df candy$ then the variable name.
4. Making a bar chart
Bar chart
barplot(candy$MM_P,
       names.arg = candy$Color,
       xlab = "Color",
       ylab = "Count",
       main = "M&M Peanut Counts by Color")
Make a more visually appealing graph by adding colors to the bars. After names.arg insert new line
col = candy$Color,
5. Plotting Scatterplot
Scatterplot
plot(candy$MM_P, candy$MM_C,
     main="Title",
     xlab="X label",
     ylab="Y label")
Creates a scatterplot.
Add Labels to Points
text(candy$MM_P, candy$MM_C,
     labels = candy$Color, pos = 3)
Adds color names near points.
6. Correlation
| Task | R Code | Meaning |
|---|---|---|
| Compute correlation |
|
Measures strength and direction of linear association. |
| Example |
|
Correlation between MM_P and MM_C. |
Interpretation:
-
Near +1 → strong positive relationship
-
Near 0 → weak/no linear relationship
-
Near –1 → strong negative relationship
7. Linear Models
Fit Model
model <- lm(MM_C ~ MM_P, data = candy)Reads as: Predict Chocolate counts using Peanut counts.
View Model Summary
summary(model)Provides:
-
Intercept
-
Slope
-
R-squared
-
p-values
Model Equation Form
General structure:
Y=β0+β1X
In this assignment:
Chocolate=Intercept+(Slope)×Peanut
8. Common Errors and Fixes
| Problem or error message | Likely Cause | Fix |
|---|---|---|
| “object not found” | Misspelled name | Check capitalization |
| File not found | Wrong directory |
|
| First row becomes data | Forgot
|
Add argument |
| Plot looks wrong | Reversed X and Y | Check order in
|
| Unexpected symbol or invalid input | Smart quotes from Word, Google Docs, or web page | Replace “ ” with standard quotes
|
References and Suggested Readings
Grolemund, G. (2014). Hands-on programming with R. Bookdown version available at RStudio Education.
Lander J. (2017). R for Everyone: Advanced Analytics and Graphics, 2nd Edition. Addison-Wesley Data & Analytics Series, Addison-Wesley Professional, Boston, MA.
UK Government Analytical Community. (2020). Quality assurance of code for analysis and research (version 2025.2). Office for National Statistics, Analytical Standards and Pipelines hub: https://best-practice-and-impact.github.io/qa-of-code-guidance/
The folks at R-Project have made available a number of reference manuals:
- An Introduction to R
- The R language definition
- The R Reference Index
/MD