Answers: Nonparametric tests
Homework 9: Common nonparametric tests
Answers to selected problems
1. Select all that apply. Assumptions of parametric tests include
A – D are all true.
E is not strictly an ANOVA assumption, but is an experimental design assumption. If subjects are present in more than one treatment group, then this needs to be treated as a repeated measures design. If treated separately, the consequence would be that error variance would be correlated and therefore a violation of the independence of errors.
3. Select all that apply. If one or more parametric test assumptions are violated, what options are available to the analyst?
A – D and F are all viable approaches. One should not proceed to do all possible tests, even if valid approaches, because of the elevated Type I error associated with multiple comparisons problem discussed in Ch12.1 – The need for ANOVA.
E is a tricky one — the easiest things is to say, nope, not appropriate. However, parametric tests typically have more statistical power — defined in Ch11.1 – What is statistical power? — compared to nonparametric alternatives and, importantly, are not at risk of huge biased estimates provided working with large sample sizes.
5. One could take the position that only nonparametric alternative tests should be employed in place of parametric tests, in part because they make fewer assumptions about the data. Why is this position unwarranted?
Reflexive adherence to nonparametric approaches is not a conservative approach, that is, nonparametric tests may result in greater chance of committing Type II errors — failing to reject the null hypothesis when one should.
7. True/False. Resampling tests like the bootstrap are types of nonparametric tests.
True. We discuss resampling in Ch19 – Distribution free statistical methods.
9. Conduct an independent t-test and a separate Wilcoxon test on the Lizard body mass data (data set in Ch15.2 and repeated below).
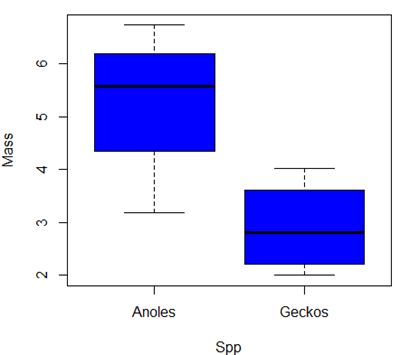
Make a box plot to display the two groups and describe the middle and variability.
Compare results of test of hypothesis. Do they agree with the Wilcoxon test? If not, list possible reasons why the two tests disagree.
t-test, assume equal variances
> t.test(Mass~Spp, alternative='two.sided', conf.level=.95, var.equal=TRUE, data=tLizards)

Two Sample t-test

data: Mass by Spp
t = 2.7117, df = 6, p-value = 0.03503
alternative hypothesis: true difference in means between group Anoles and group Geckos is not equal to 0
95 percent confidence interval:
0.2308685 4.4981315
sample estimates:
mean in group Anoles mean in group Geckos
5.27425 2.90975
Wilcoxon test, default selections
> Tapply(Mass ~ Spp, median, na.action=na.omit, data=Lizards) # medians by group
Anoles Geckos
5.5870 2.8065
Note: Rcmdr arranges the data in the format needed to complete the Wilcoxon test
> wilcox.test(Mass ~ Spp, alternative="two.sided", data=Lizards)

Wilcoxon rank sum exact test
data:  Mass by Spp
W = 14, p-value = 0.1143
alternative hypothesis: true location shift is not equal to 0
code: Boxplot(Mass ~ Spp, data=Lizards, id=list(method="y"), col="blue")
| Statistical test | p-value | Null hypothesis? |
| t-test | 0.03503 | reject |
| Wilcoxon test | 0.1143 | accept |
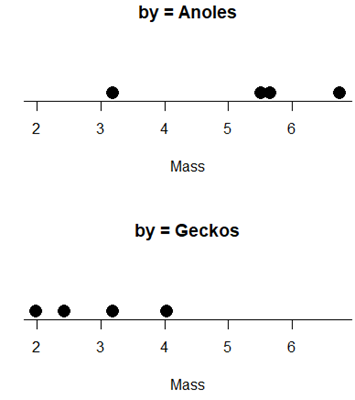
with(tLizards, RcmdrMisc::Dotplot(Mass, by=Spp, bin=FALSE))

