Measurement day
Objective: Explore concepts of measurement error and data collection
- bias: any non-random error associated with a measurement
- biological error: individuals differ for some measured trait
- censored data: value of an observation is only partially known, e.g., true value is beyond instrument measuring limits
- error: differences between observed and true value
- interobserver error: reproducibility of repeated measures of same object, different observers
- intraobserver error: reproducibility of repeat measures of same object, same observer
- missing value: observed value is unknown
- truncated data: values beyond a boundary limit are excluded, either when measured or when analyzed.
refer to Chapters 2.4, 2.5, 2.6, and 3.4 in Mike’s Biostatistics Book.
About human subjects data
Some of the projects call for measures on a person. Remember, no person is required to participate. All subjects are assigned a random ID number; once the data are submitted, a new random number is assigned and any connection between the subject and the data are further anonymized by the addition of random noise (jitter) to each value.
To do
For each of the projects, briefly discuss, agree upon measures to make and how to make them, and record these decisions to the meta sheet. Review together the concepts listed above and how they are — or are not — relevant to the data collection planned for the day. Include as part of your design ways to estimate the different sources of error. Discuss possible sources of bias with each measure.
Note that you play two roles in this project: researcher/observer and, for some measures, you are asked to record data on yourself — that’s a human subjects consideration. The purpose of this exercise is educational, not research. The data will not be shared beyond the classroom, but I recommend that for any measure on yourself, use the anonymous id assigned to you by the instructor.
Setup and utilize a spreadsheet to record data. Setup new worksheets for each project. Include a meta sheet — also known as a data dictionary or codebook — to include standard kinds of information needed to recreate the work you do. See Table 1 and Table 2 for examples that follow the row and column format. For more help with proper data entry and data management in spreadsheets see Spreadsheets and data entry.
Make sure that your data are submitted to DrD via CANVAS. Your results will be collected and returned to the class for use in Homework 2A: Measurement Day results.
Hint 1: Think about how to assess inter- and intra-observer error (hint: one trial or many trials?)
Hint 2: Think in terms of “threes”. For example, if you wish to compare performance of a ruler vs the calipers for measuring shell length — at a minimum — record three independent measures of the shell with the same ruler, and another three measures with the calipers. Repeat for as many samples that you have.
Hint 3: Think about steps you can take in obtaining measures to minimize sources of bias.
In-person, eight projects (remote = three projects) plus additional suggested project ideas.
Remote students: Do projects
1 (online dart game)
2 (shell images)
6 (internet bandwidth speed test).
1. Dartboard: How to assess accuracy? Precision?
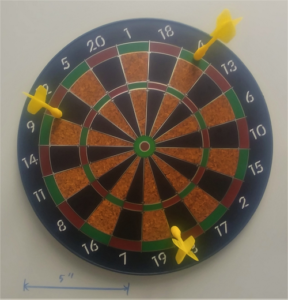
Figure 1. Results of toss of three darts
In-person
General: each student should toss one set of darts (3 darts). Each student should toss darts.
For tossed darts, record the distance between the center (bulls eye) and the location of the tossed dart. Use results to calculate accuracy and precision, per discussions in Chapter 3 of Mike’s Biostatistics Book.
Take a digital picture of each results — include a unit measure marker of known length with the image (e.g., dartboard diameter). From the image, extract information, e.g., length between dart toss and center of the target, where accuracy is judged as close to the bulls eye (center of target). Although you could measure the distances on your screen (get diameter length on the screen and correct if to actual diameter of the dart board), best to use software designed for this purpose, e.g., imageJ or R package digitize.
Note: The boards used in class have a diameter of 11.5 inches (29.21 cm). Additional details provided in class, which should be recorded as part of your meta data.
Remote
General: Instead of tossing darts in-person, try an online dart game: https://www.transum.org/Maths/Game/Darts/ . Each student should “toss” darts, record each trial by screenshot. From the image, extract information, e.g., length between dart toss and center of the target , where accuracy is judged as close to the bulls eye (center of target).
Note: A standard dart board is 17.75 inches (45.1 cm); assume the digital dartboard is a standard sized dart board.
2. Shells, shell length as measure of “size”
In-person
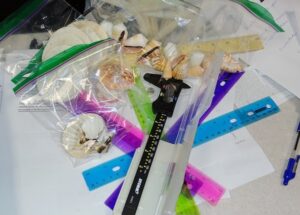
Figure 2. Shells, calipers, and rulers.
I have set out an assortment of “shells” for you to measure, including
- Shelled gastropods (snails)
- Giant African snails Lissachatina (formerly Achatina) fulica
- Conus species
- C. spurius
- C. quercinus
- Echinoderms
- Sea stars (Protoreaster nodosus and Linckia laevigata)
- Bivalves
- Scallops (Pectinidae)
- Urchins
- Sand dollars (Dendraster excentricus)
- Hint: Although radial symmetry, adult sand dollar bodies show bi-lateral symmetry, a front and a back.
- Question: What’s causing that rattling sound when you shake (gently, please!) a sand dollar? Ask Google and find out 😉
- Sand dollars (Dendraster excentricus)
Links to Wikipedia pages.
Rulers and calipers are provided. If available, you may have an app on your phone (e.g., AR ruler), that can estimate lengths from 3D shapes — that would be a great addition to the project: agreement between caliper reading and an app reading on the same object?
Take images and extract information, e.g., length (longest dimension) and width (widest dimension) of shell.
Suggested worksheet organization
| Shell | Image ID | Observation | Pixels/cm ** | Length (pixels) ** | Width (pixels) ** |
|---|---|---|---|---|---|
| Conus | 1 | 1 | 12 | 79.906 | 60.745 |
| Conus | 1 | 2 | 12 | 79.906 | 64.195 |
| Dendraster | 4 | 1 | 12 | 101.494 | 92.049 |
| Dendraster | 4 | 2 | 12 | 101.316 | 94.133 |
* Don’t assume my measurements are “correct.” Do your own work!
** Units should be reported in metadata, not as part of variable name.
Note: Pixels (pels) are the smallest units of a digital image. See Wikipedia for further information.
Remote
In place of physical access to the shells, get length (longest dimension) and width (widest dimension) of shell from images. Figure 3 contains 17 Conus spp shells; Figure 4 has 18 Dendraster excentricus shells.
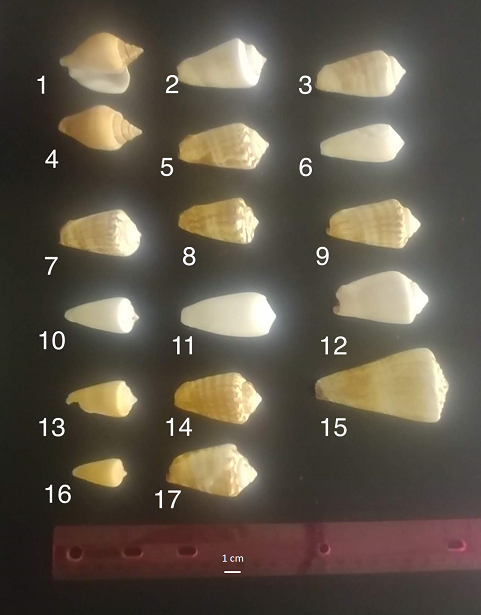
Figure 3. Seventeen Conus shells. Unit measure 1 cm. Image by M. Dohm
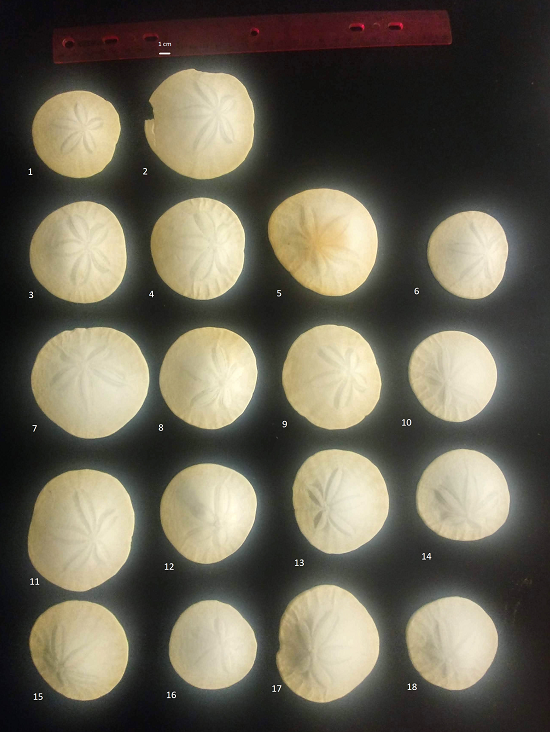
Figure 4. Eighteen Dendraster excentricus shells. Unit measure 1 cm. Image by M. Dohm.
Bonus
In-person activity. Record length and width of object with a ruler or caliper. Next, take image of same object, include a unit measure marker, and get length and width from the image with imageJ or R package digitize.
3. Measure your lung vital capacity
Covid-19 update: We may skip this measure. Assessing proper lung function is an important clinical measure. A spirometer is the device of choice, but we can approximate the device reasonably well with a simple balloon and an appreciation for how to apply experimental design principles to overcome limitations of an imprecise instrument (e.g., a balloon!). Grab a deflated balloon, take a deep breath, then expel all of your air into the balloon. (Improved function may be had by first inflating the balloon before a breath trial to improve the elasticity of the balloon.) The size of the inflated balloon is a measure of your lung forced vital capacity, FVC. (A related measure, FEV1, is measured the same way, but expel breath for one second only. The ratio  is a key clinical indicator of lung function). FEV1 is pretty hard to get by blowing up a balloon!
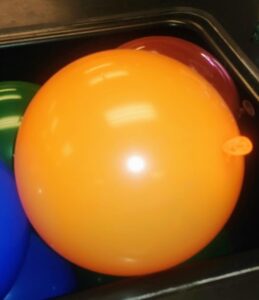
Figure 5. Filled up balloon.
Tie off the balloon and retrieve a nylon cord. Wrap the nylon cord around the middle of the balloon and note where the end of the cord meets the wrapped cord. Holding the place with your finger transfer the cord to a tape measure to record the circumference of the inflated balloon. Share with the class your age, height, gender, and average FVC.
Example in R
Copy/paste code to your Script Window in R Commander.
# Dr Dohm's FVC values (inches) for three balloons. Equations require liters and centimeters.
# FEV1 was 15.8 inches, based on one balloon.
balloon <- c(22, 23, 23.5)
radius <- (balloon*2.54)/(pi*2)
#volume of a sphere
FVC <- ((pi*radius^3)*4/3)/1000;FVC
#Predicted FVC
Age <- 58
Height <- 68*2.54
FVCpred <- (27.63 - (0.112*Age)*Height)/1000
#Print the results
cat("FVC estimates: ", FVC, "\n")
cat("Predicted FVC: ", FVCpred)
Optional
Try a digital flow meter to record PEF and FEV1 (cf. Quanjer et al. 2012), compare to balloon measurements.
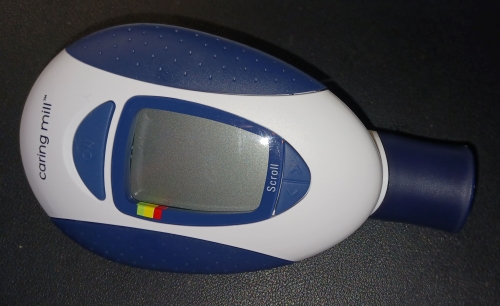
Figure 6. Peak flow and FEV1 monitor.
4. Predict core body temperature from measures of skin temperature
Core body temperature is an important clinical measure. The best way to get core body temperature is with use of oral or rectal thermometers, but obviously, these are less than convenient. Under typical settings we would expect that skin temperature would be proportional to core temperature. Assume core body temperature is 37 °C. The purpose of this measure then is to acquire temperature readings from skin temperatures and construct equations to predict core body temperature (see Lenhardt and Sessler 2007). We have three infra red thermometer guns; fresh 9 volt batteries will be made available.
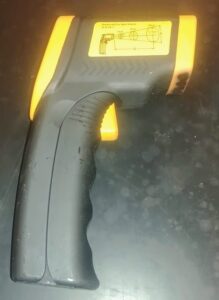
Figure 7. IR handheld temperature device.
R Example
Example: three devices, took three measures of back of the throat and three measures of skin temperature from the forehead.
Copy/paste code to your Script Window in R Commander.
device <- c("1", "1", "1", "2", "2", "2", "3", "3", "3")
throat <- c(95, 95, 95.2, 97.5, 98.4, 98.6, 97.4, 96.5, 96)
forehead <- c(85, 85.1, 84.5, 86.7, 86, 86.3, 85.5, 85.2, 85.3)
tmp <- data.frame(device, throat, forehead)
scatterplot(throat~forehead | device, regLine=TRUE, smooth=FALSE, boxplots=FALSE, by.groups=TRUE, data=tmp)
abline(lm(throat ~ forehead))
5. Accuracy and precision of volumetric pipettor
- Open a spreadsheet file.
- Create a meta data sheet, which would include a description of what you are doing. Include also room temperature and barometric pressure.
- The second worksheet would be for data recording
- Grab distilled water
- Place a weighing boat onto the balance and tare.
- Select the first pipettor and pick an appropriate volume. Pipet that volume of distilled water into the pipettor, then dispense the amount into the weighing boat.
- Record the volume and the corresponding weight into the cell of the worksheet and also into your notebook.
- For each volume, repeat for a total of four readings.
- Use the same volume, change tips between readings to avoid carryover.
- Import the spreadsheet into R, then calculate appropriate statistics (mean, corrected mean, standard deviation, coefficient of variation, and percent accuracy).
6. Speed test internet
Get repeated readings of your Wi-Fi bandwidth access speed. There are many sites to check your internet latency (milliseconds), download (megabytes per second), and upload (megabytes per second) speeds; we’ll use “run an NDT test” at Measurement Lab (NDT stands for network diagnostic test. as opposed to other industries, nondestructive test). Internet speed can vary for a number of reasons, including time of day, number of users on a single connection, location, to name a few.
Here are a few observations I made on my office desktop, connected to campus Wi-Fi or via hotspot on my cell phone.
Table 2. Bandwidth speeds by Wi-Fi type and time of day
| Wi-Fi | Time | Latency (ms) | Download (MBps) | Upload (MBps) | Test server location |
| Campus | 8:15 AM | 56 | 91.08 | 74.19 | San Francisco Bay Area |
| Campus | 8:19 AM | 63 | 88.67 | 57.43 | San Francisco Bay Area |
| Campus | 12:31 PM | 63 | 51.73 | 33.69 | San Francisco Bay Area |
| Campus | 12:36 PM | 70 | 1.90 | 38.10 | San Francisco Bay Area |
| Hotspot | 1:02 PM | 92 | 9.94 | 0.27 | Los Angeles |
| Hotspot | 1:06 PM | 96 | 21.64 | 0.47 | Los Angeles |
| Campus | 1:08 PM | 55 | 44.61 | 16.23 | San Francisco Bay Area |
| Campus | 1:13 PM | 55 | 7.32 | 22.61 | San Francisco Bay Area |
Try this yourself. Think about how you would gather observations to separate factors that affect internet speed. For example, location vs. time of day.
7. Constant volume (bomb) calorimetry
Will provide students with an aluminum calorimeter (Eisco) to measure amount of energy released through burning food. Dried bananas and peanuts provided.
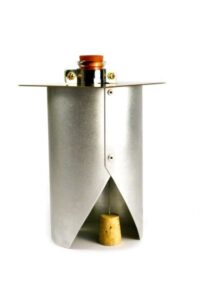
Figure 8. Simple food calorimeter. Not shown, thermometer or thermocouple to monitor temperature change.
The principle is straightforward. Burn a known quantity of food onto a nail in the placed cork directly under flask with known volume of water, record the change in temperature of the water.

where Q is the amount of heat gained by a sample (e.g., calories), m is the mass of water, c is the specific heat of water (1 calorie/g), and  is the temperature change. To obtain the calories per unit mass of a food stuff, divide Q by the change in mass of the food item after burning.
An example calculation
125 ml of water (= 125 g) placed into the flask. Initial water temperature,  , was 21.2 °C. Initial mass of food sample (+ cork + nail),
  , was 10.0 g. After the food item completed burn, end water temperature,
  , was 39.8 °C and end mass of food sample (+ cork + nail),
  , was 9.7 g. Thus,
  .
.
With the formula we have  , which should be converted to kilocalories (common units for food items), or
  . And finally,

8. Skittle count
One mini bag per student, tally the number of beans of each color
Green
Orange
Purple
Red
Yellow
9. Additional suggestions
Question 1. Does nail polish affect measurement of pulse or oxygen saturation, SpO2, by pulse oximetry? (cf. Coté et al. 1988)
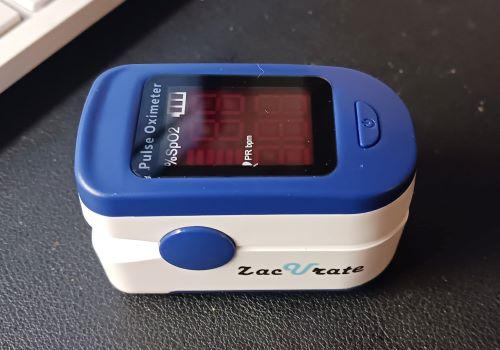
Figure 10. Pulse oximeter
Question 2. How well does a person’s estimate of their own height (weight) reflect actual height?(cf. Rowland 1990)
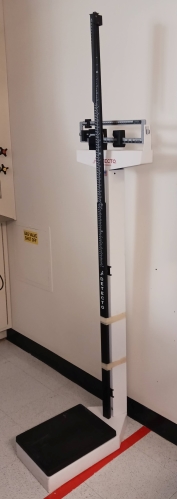
Figure 11. Weightbeam clinical scale with height rod.
Question 3. How rapidly does systolic/diastolic blood pressure return to resting values following a bout of isometric exercise? (cf. Forjaz et al. 1998; Cohen et al. 2023)
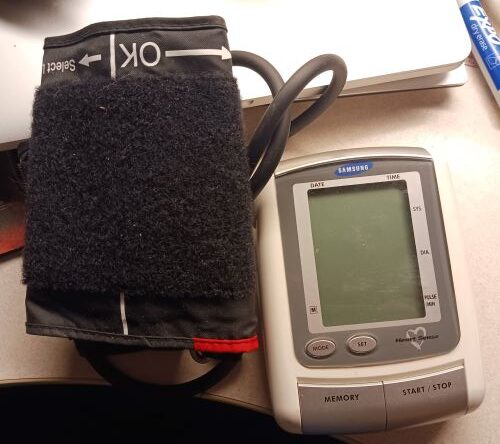
Figure 12. Blood pressure monitor.
4. Does how a seated patient hold their arm influence systolic or diastolic readings?
References
Berg, S. (2023) AMA 4 big ways BP measurement goes wrong, and how to tackle them
Cohen, D. D., Aroca‐Martinez, G., Carreño‐Robayo, J., Castañeda‐Hernández, A., Herazo‐Beltran, Y., Camacho, P. A., … & Lopez‐Jaramillo, P. (2023). Reductions in systolic blood pressure achieved by hypertensives with three isometric training sessions per week are maintained with a single session per week. The Journal of Clinical Hypertension, 25(4), 380-387.
Coté, C. J., Goldstein, E. A., Fuchsman, W. H., & Hoaglin, D. C. (1988). The effect of nail polish on pulse oximetry. Anesthesia & Analgesia, 67(7), 683-686.
Forjaz, C. L. D. M., Matsudaira, Y., Rodrigues, F. B., Nunes, N., & Negrão, C. E. (1998). Post-exercise changes in blood pressure, heart rate and rate pressure product at different exercise intensities in normotensive humans. Brazilian journal of medical and biological research, 31, 1247-1255.
Kohn, A. J., & Riggs, A. C. (1975). Morphometry of the Conus shell. Systematic Zoology, 24(3), 346-359.
Lenhardt, R., & Sessler, D. I. (2006). Estimation of mean body temperature from mean skin and core temperature. The Journal of the American Society of Anesthesiologists, 105(6), 1117-1121.
Quanjer, P. H., Hall, G. L., Stanojevic, S., Cole, T. J., & Stocks, J. (2012). Age-and height-based prediction bias in spirometry reference equations. European Respiratory Journal, 40(1), 190-197.
Rowland, M. L. (1990). Self-reported weight and height. The American journal of clinical nutrition, 52(6), 1125-1133.