Part 06. Work with an included dataset
What’s on this page?
- About data sets and data files
- Explore a dataset included with R
- To do
- View the dataset
- Explore the dataset
- dim()
- head()
- tail()
- names()
- length()
- typeof()
- Move around a data frame
- Quiz
What to do
Complete the exercises on this page
- Explore a dataset included with R
How to do it
For these exercises, you may work
- within the Rcmdr script window
- at the command line and R prompt
- from a script document and the R GUI app
- RStudio
Choose one way. The quickest way is to just work with R Commander.
Let’s begin.
Before you start
A reminder, always set your working directory in R first before beginning a project (see Part 02. Getting started with R and Rcmdr), before starting to do your analyses. Makes life a lot easier.
1. About data sets and data files
Statistics is all about working with data sets. Data sets may come from many different sources:
- entered directly during an R session and saved to a data frame object.
- extracted from a table from the CDC, or Wikipedia, or other online sources. Like many programming languages, R can do web scraping, which permits collecting data from websites and putting the data into a form suitable for R.
- text file (generic file extension
.txt), often with columns separated by columns (e.g.,.csvfiles) or tab-delimited (e.g.,.tsvfiles). - Spreadsheet file (generic file extension
.ods; Microsoft Excel extension.xlsor.xlsx). - R data files, file extension
.Rdata(or.rda).
Example data sets are commonly included for R packages. This page is about working with data sets included as part of the installation of R and R Commander.
2. Explore a dataset included with R
To begin, explore the available data sets. At the R prompt type the command
data()
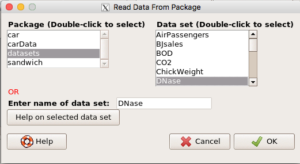
Alternatively, type and submit the same command in the R Commander script window. A popup window lists available data sets by package, file name, and title of the dataset. For example, DNase, which is in the datasets package (Figure 1).
R packages typically include documentation and the package datasets is no exception. To view included information about the the data sets included in datasets in your browser type the command
help(package="datasets")
Note: help files are by default just text files. Recent versions of R includes by default displaying html help pages. The html pages are displayed by a server included during the installation. This server is also used to display RMarkdown files.
Select and load a data file from attached package into R. From within R Commander, select Data → Data in packages → Read data set from an attached package.
You can try any of the data sets, but a nice one to work with is DNase, which is in the Datasets package (Figure 1).

Figure 1. Screenshot of R Commander select data from attached packages.
Alternatively, at the R prompt type
data(DNase, package="datasets")
To simplify your work, go ahead and attach the dataset. By attaching the data, you won’t have to type the dataset and variable name each time (e.g., DNase$conc), only the variable name (conc).
attach(DNase)
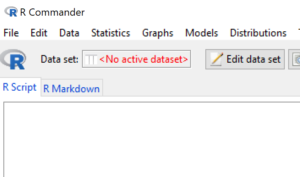
R Commander keeps track of active datasets available for use. Note in the menu area the box marked Data set. Before a dataset is loaded, R Commander shows “No active dataset” (Fig. 2).

Figure 2. R Commander, no active dataset
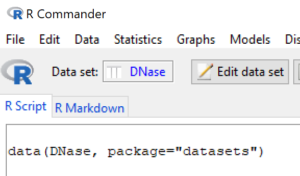
After dataset is loaded, R Commander updates to show available datasets (Fig. 3).

Figure 3. R Commander, one active dataset available.
3. To do
Once the data set is ready to go,
- View the data
- Just type the name of the dataset at the R prompt, or within Rcmdr, select the View or Edit button.
- Note that you may need to find the popup window! Our small laptops have very little display real estate, so any new windows created by R or R Commander may be hidden behind a visible window.
- MacOS and Win11 tip: A quick way to find and select open windows on your computer is to use a simple keystroke sequence: Alt + Tab. Hold down the Alt key, then select Tab key — you’ll see available windows. Repeat tap Tab key to cycle through and select available windows.
- Just type the name of the dataset at the R prompt, or within Rcmdr, select the View or Edit button.
- Explore the data set
- For now, this means noting what the variable names are, noting the data types of the variables are, etc. Commands to try include
dim()- Returns the number of rows and columns in the dataset. Example (red) and output
dim(DNase)
[1] 176 3
-
head()- View the first six rows of the dataset. Example (red) and output
head(DNase)
Grouped Data: density ~ conc | Run
  Run       conc density
1   1 0.04882812   0.017
2   1 0.04882812   0.018
3   1 0.19531250   0.121
4   1 0.19531250   0.124
5   1 0.39062500   0.206
6   1 0.39062500   0.215
-
tail()- View the last six rows of the dataset. Example not shown.
-
names()- Returns names of the objects in the dataset. Example command (red) and output
names(DNase)
[1] "Run" "conc" "density"
-
length()- Just enter the variable name into the parentheses to check the number of observations of the variable. Example and output
length(Run)
Oops, that returns an error message!
[3] ERROR: object 'Run' not found
This error results because, although “Run” variable is part of the loaded dataset, the dataset is not attached. Thus, the simplest fix is to attach the dataset (see above), or specify that “Run” is a variable in the dataset DNase.
length(DNase$Run)
now returns
[1] 176
-
typeof()- Returns the (internal) type or storage mode of any R object. Example and output
typeof(DNase$Run)
[1] “integer”
- Move around a data frame
- Syntax for selecting a particular value is row, column. R data frames are like worksheets in spreadsheet apps: data are organized by rows and columns. You get used to looking at
head(DNase)print outs, but most of us find looking at spreadsheets easier. So, to introduce “moving around a data frame,” lets view output from head(DNase) as it would appear in a spreadsheet.
- Syntax for selecting a particular value is row, column. R data frames are like worksheets in spreadsheet apps: data are organized by rows and columns. You get used to looking at
| id | Run | conc | density |
|---|---|---|---|
| 1 | 1 | 0.04882812 | 0.017 |
| 2 | 1 | 0.04882812 | 0.018 |
| 3 | 1 | 0.1953125 | 0.121 |
| 4 | 1 | 0.1953125 | 0.124 |
| 5 | 1 | 0.390625 | 0.206 |
| 6 | 1 | 0.390625 | 0.215 |
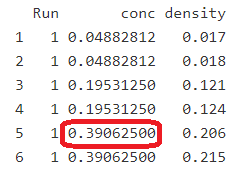
Now, if we wish to select the same value in our spreadsheet — we skip the header row (row 1) — so row 6, column C, we would type “=C6” in an empty cell (without the quotes). In R, we can do the same thing by calling the elements directly by number data.frame[rows,columns]. For example, DNase[5,2] points value at row 5, column 2 (value = 0.390625, see output from names(DNase) above; Fig. 4).
Figure 4. Red box highlights selection of DNase[5,2]
R uses the square brackets to help index a data frame (or a vector or a matrix). If we wish to select values three through five conc, we write DNase[2:5,2] (values = 0.1953125 0.1953125 0.3906250; Fig. 5).
Figure 5. Red box highlights selection of DNase[2:5,2]
4. Page quiz
Included datasets
Seven questions from this page

