Homework 2A: Measurement Day results
This homework is about data exploration. Data exploration includes description (central tendency, dispersion) and use of graphics to visualize the data. These homework questions are general to steps a researcher takes with any new dataset.
Homework 2 expectations
Read through the entire homework before starting to answer a question. Answer questions for the “Darts” data acquired by BI311 class; the data are included as a table at the end of this page.
BONUS: Pick one or more additional data collected by you from Measurement Day (e.g., shells, temperature, lung volume, etc., but not darts). Repeat data exploration questions below, adjusted for the type of data collected. BONUS points awarded for each successfully completed additional data set, for a maximum of 5 additional points.
How to work this homework
You may work together, but each of your must turn in your own report. Don’t “plagiarize” from each other. Do include in your report who you worked with.
What to turn in: A pdf file containing your R code, statistical results, and your answer to the questions. Use of RMarkdown recommended; however copy/paste into a word document is also acceptable.
Submit your work to CANVAS. Obey proper file naming formats.
Resources for this homework
Mike’s Biostatistics Book: Chapter 3, Chapter 4
Mike’s Workbook for Biostatistics: A quick look at R and R Commander, Part01 – Part10
Additional R commands and or code provided
Questions for Darts data set
- How many observations are there?
- What are the variables in the data set and what are their data types?
- How many missing values?
- What is most likely explanation for missing data?
- Data not recorded
- Data censored
- Data truncated
- How many total darts were thrown?
- Get visualizations of the data and describe what you see in relation to what the graph allows you to tell about the data. Use the default graphs (Rcmdr: Graphs)
- Histogram
- Box plot by student
- Box plot by dart
- Get visualizations of the data and describe what you see in relation to what the graph allows you to tell about the data. Use the ggplot2 graphs
- Histogram
- Box plot by student
- Box plot by dart
- Calculate the middle number of darts thrown per student. Arrange and report the values for mean, median, mode from smallest to largest. Compare these values against the histogram plot and describe what you find. Explore use of Rcmdr: Statistics → Summaries → Numerical summaries … vs Table of statistics …
- Mean
- Median
- Mode
- Calculate the middle distance from the center of darts thrown per student. Arrange and report the values for mean, median, mode from smallest to largest. Compare these values against the histogram plot and describe what you find. Explore use of Rcmdr: Statistics → Summaries → Numerical summaries … vs Table of statistics …
- Mean
- Median
- Mode
- Calculate the dispersion distance from the center of darts thrown per student. Explore use of Rcmdr: Statistics → Summaries → Numerical summaries … vs Table of statistics …
- range
- standard deviation
- coefficient of variation
- skewness
- kurtosis
- Which measure of dispersion from question 10 bests reflects “accuracy”? Which bests reflects “precision”?
- Describe in 50 words or less the darts measures and the concept of bias.
R commands, copy & paste to Script
Install Rcmdr plugin, RcmdrPlugin.KMggplot2
Use drop down menu, or type and submit the following code in script window
install.packages("RcmdrPlugin.KMggplot2", repos="https://cloud.r-project.org")
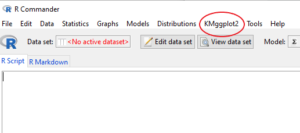
- Restart Rcmdr, then Rcmdr: Tools → Load Rcmdr Plugins…
- Load plugins window, select RcmdrPlugin.KMggplot2, click OK
- A popup menu appears, restart Rcmdr. When Rcmdr restarts you should see KMggplot2 added to menu strip.
Read table of data
darts <- read.table(header=TRUE, sep="\t", text=" ")
Select and copy data including header row and paste between the " " of text = " "
Alternatively, copy and paste data from the table to a spreadsheet file, then import data from the saved spreadsheet file (Rcmdr: Data → Import data → from Excel file…)
Darts data from Fall 2021. Distance was inches from center
| Student | Dart | Distance |
| aar | 1 | 4.72 |
| aas | 1 | 20.87 |
| aat | 1 | 5.51 |
| aau | 1 | 15.75 |
| aav | 1 | 0.79 |
| aar | 2 | 14.96 |
| aas | 2 | 5.12 |
| aat | 2 | 7.09 |
| aau | 2 | 3.54 |
| aav | 2 | 1.57 |
| aar | 3 | 5.51 |
| aas | 3 | 7.48 |
| aat | 3 | 17.72 |
| aau | 3 | 3.54 |
| aav | 3 | 3.54 |
| aaw | 1 | 1.50 |
| aax | 1 | NA |
| aay | 1 | 1.50 |
| aaz | 1 | 1.00 |
| aaw | 2 | 6.50 |
| aax | 2 | NA |
| aay | 2 | 2.40 |
| aaz | 2 | 1.20 |
| aaw | 3 | 8.50 |
| aax | 3 | NA |
| aay | 3 | 11.40 |
| aaz | 3 | 2.00 |
| aaw | 1 | 5.60 |
| aax | 1 | NA |
| aay | 1 | 5.70 |
| aaz | 1 | 1.20 |
| aaw | 2 | 5.00 |
| aax | 2 | NA |
| aay | 2 | 3.50 |
| aaz | 2 | 0.90 |
| aaw | 3 | 2.50 |
| aax | 3 | 11.00 |
| aay | 3 | 2.60 |
| aaz | 3 | 2.20 |
| aaw | 1 | 1.50 |
| aax | 1 | 3.50 |
| aay | 1 | 2.40 |
| aaz | 1 | 2.50 |
| aaw | 2 | 1.50 |
| aax | 2 | 3.50 |
| aay | 2 | NA |
| aaz | 2 | 2.70 |
| aaw | 3 | NA |
| aax | 3 | 5.50 |
| aay | 3 | 6.20 |
| aaz | 3 | 9.50 |
| aba | 1 | 1.28 |
| aba | 2 | 0.98 |
| aba | 3 | 4.23 |
| abb | 1 | NA |
| abb | 2 | NA |
| abb | 3 | NA |
| abc | 1 | 3.44 |
| abc | 2 | 4.41 |
| abc | 3 | NA |
| abd | 1 | 3.74 |
| abd | 2 | 3.62 |
| abd | 3 | NA |